


Beneath its shiny surface, the SAT adversity score is riddled with rust

More stories from Abby Wright
On a scale of one to 100, how would you rate how unfortunate you are?
50 being average.
So, a 49 is considered privileged.
Last week, College Board announced that it will be adding yet another number to a student’s profile: the adversity score. A score that quantifies the hardships a student—a child—has faced.
This score is apparently precisely and diligently calculated, pulling from 15 variables in three different areas: family environment, neighborhood environment, and high school environment. So, pulling from these three areas, the College Board is placing each student on a scale; their number will be shared with colleges along with their SAT score.
Taking a surface-level look at the basic facts, it seems as if the College Board is acknowledging the adversity that some students face in an attempt to “level the playing field.”
But I don’t quite understand that. It was uneven to begin with.
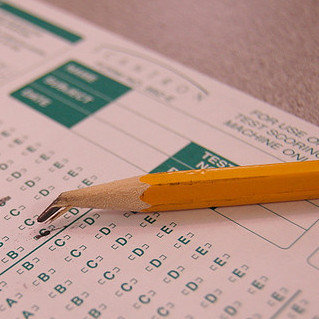
The SAT is an expensive, yet mandatory, test, so students from lower-class families are on the bench while students from upper-class families are the star pitchers. Already, some students are at an advantage simply because they can afford tutors, study materials, and the test itself.
I don’t understand this attempt to flatten a rocky mountain, but an even bigger aspect of the College Board’s recent announcement that I don’t understand is how you can even measure adversity? And who gave this organization the right to do that?

Apparently, the factors they gather data from range from the crime or poverty rate in their neighborhood or how many parents live in a household to what their median income is or curricular rigor of the student’s school. These are just a few of the 15 factors. The College Board draws this data from a community census, or other outside sources that they have neglected to mention, and this data results in an “overall disadvantage level,” which then places that student on an adversity scale.
One to 100, and 50 is average.
With anything data-driven like this, it’s impossible to take note of every special situation or circumstance. In some cases, a student living with their single mom is the equivalent to a student living with two parents, one of which is an alcoholic or maybe is abusive.
Every situation is different which is why I don’t quite understand how this so-called “adversity score” can be measured. Why is it being measured? How can you measure adversity, the hardships a student faces throughout their life, where they came from, and where they are now? Why is this being measured?
At the end of the day, it seems like the College Board is gathering data—an average, a median, a consensus—that shrinks students to yet another number.
A number that these students can’t even see.
Admissions officers see the number the students have been reduced to, but the actual kids can’t. They have no idea where they place on this scale. It’s bad enough that the College Board, this non-profit organization, is determining how much adversity students are facing, but the fact that the students can’t even see their score pulls the blindfold even tighter around their eyes.
Sent alongside SAT scores, the adversity score makes its way into admissions officers’ hands and is taken into consideration when considering college applicants. This socioeconomic score determines students’ futures, and they don’t have the ability to see it.
I guess I just don’t understand.
What are the College Board’s motives behind attempting to level an already uneven playing field? Who gave them the ability to measure adversity? How can something like this be measured, and why can’t students see their score?
On a scale of one to 100, how would you rate how unfortunate you are?
50 being average.
So, 51 is considered underprivileged.
Abby Wright is a senior entering her fourth and final year on staff for The Central Trend, and second year as Editor in Chief. She values art, Spotify...